Authenticating Internal Fault in a 315 MVA Transformer with the Help of SFRA Test – A Case Study
ABSTRACT:
SFRA is the acronym of Sweep Frequency Response Analysis. This particular test was invented by the Chinese Engineers/Scientists in the year 2004, and a Standard was released to this effect by the People’s Republic of China as DL/T 911-2004.
The Transformer inherently has resistance, inductance and capacitance; therefore, it constitutes a unique RLC circuit. Since the Inductance and the Capacitance are frequency-dependent parameters, therefore the total impedance of each transformer shall differ. SFRA has emerged as a powerful and sensitive tool for evaluating the mechanical and geometrical integrity of core, windings and clamping structure of a Power transformer by plotting variation in the curve in dBs over the frequency range from 20 Hz to 2 MHz. The health-status can be assessed without opening or dismantling the transformer. Thus, this test can be designated as a “non-invasive test (non-destructive test)”.
This test is invariably performed at the OEM’s works and also on-site to verify the health-status of the Transformers. Further, this test is also performed on the transformer to evaluate the health status after major trippings and severe seismic conditions.
The maiden frequency response curves are called the signature curves or thumb-impression curves for each individual Transformer.
The Author has narrated the basic theory of the SFRA tests and has narrated a case history, authenticating the internal fault in a 315 MVA transformer through carrying out the SFRA Test.
KEYWORDS: SFRA, RLC Circuit, Non-invasive test.
1.0 THEORY/CONCEPT:
The transformer has an RLC circuit, which is shown in Figure 1.
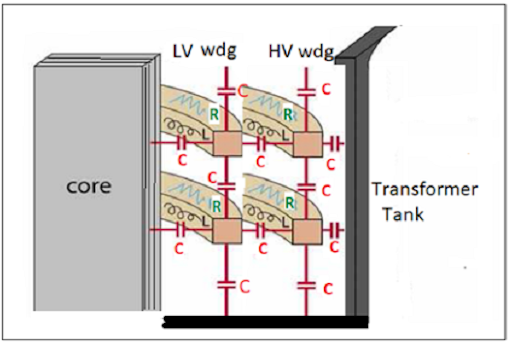
As the Power Transformer has a winding which is inherently a resistance of the conductor, the inductance is developed since it is wound in a circular fashion, and as regards the development of capacitances. Capacitance is developed between turn-to-turn, winding-to-winding, LV winding-to-core and windings-to-tank. Therefore, it is a complex piece of equipment having two frequency-based components, viz., Inductive Reactance (XL = 2πfL) and Capacitive Reactance (XC=1/2πfC) in addition to Resistance (R). So, the whole equipment has an RLC circuit of its own.
If jerks and jolts are experienced by the Transformer during transportation on a low-bed trailer, the core of the Transformer is likely to get dislocated; thus, the capacitances would vary considerably.
1.1 Test Kit:
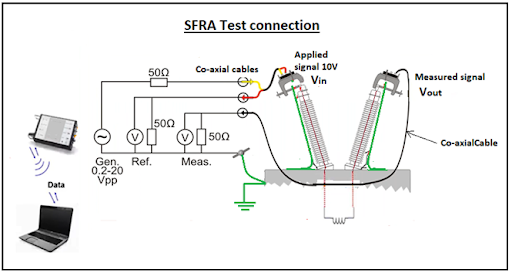
Magnitude (dB) = 20 x log10 (Voutput / Vinput)
2.0 WHEN TO SUBJECT A TRANSFORMER TO SFRA TESTS?
Each transformer has a distinct response to frequency depending upon its RLC circuit. The Sweep frequency response trace of each transformer would be unique by itself, and therefore, the maiden Sweep frequency Response Curves are called 'signature curves' or 'thumb-impression curves'.
There are several occasions/events or incidents after which the generation of as-found SFRA traces or curves is essential for evaluating the health-status of a transformer by comparing them with the signature curves. The list of occasions/events or incidents is enlisted hereunder:
a). For verification that no damage has occurred during the Short Circuit test at the OEM’s works.
b). After receipt of the consignment at the site for checking the mechanical and geometrical integrity of the transformer during Transhipment.
c). Relocation from one site to another site and also relocation at the same site due to, say, augmentation of capacity or shifting to another bay, etc.
d). Post-incident verification: Lightning, external through-fault, internal short circuits, failure of vital components like “the bushings” and severe seismic conditions.
e). After the transformer trips/alarms on:
(i) Differential or REF protection trip.
(ii) PRV trip.
(iii) Buchholz alarm/trip.
(iv) DGA report indicating thermal faults above 300°C, indicating T-2
or T-3 conditions as depicted in the IEC 60599-2007.
3.0 REGION-WISE FREQUENCY RESPONSE:
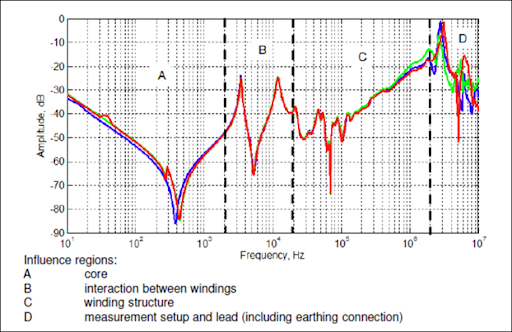
Region A - Core Effect: At low frequency (below 2 kHz), the frequency response begins with the decreasing magnitude of -20 dB/decade. This is due to the magnetizing inductance of the core. This is then followed by a minimum, which occurs due to the series resonance between the magnetizing inductance of the core and the total capacitance of the transformer. In this example, the B phase (in blue colour) is clearly different from the other two phases due to the different magnetic reluctance path of the middle leg of a three-limb core
Region B – Interaction Between Windings: Between 2 kHz and 20 kHz, the frequency response is influenced by the interaction between the windings as well as by how the windings and neutrals are connected and terminated (open/closed delta; floating/grounded).
Region C - Effect of Winding Structure of the Winding under Test: From 20 kHz up to 1 MHz, the winding structure will heavily influence the frequency response. In this example, the FRA plot for this frequency range has fewer resonances and anti-resonances and a mainly capacitive rising trend, due to the high series capacitance of the HV winding.
Region D - Effect of Leads of Taps and Earthing leads; Beyond the frequency of 1MHz, the trend of the frequency response is irregular and complex, influenced by the tap leads and the measurement earthing leads.
3.1 Summary in tabular form:
| Frequency region | Frequency | Influencing factors |
|---|---|---|
| A-Low | <2 kHz | Core |
| B-intermediate | 2–20 kHz | Interaction between windings. |
| C-High | 20 kHz– | Individual winding Structure |
| D-Very high | >1 MHz for rating >72.5 | Measurement set up and Lead (including earthing connection) |
4.0 CASE STUDY:
Capacity: 315 MVA, 400/220/33 kV Autotransformer
Incident: While normalizing after maintenance, the transformer
was charged from the 400 kV side by inadvertently not removing the
earth blades from the “on” condition. Heavy flashover was observed.
Tripping Indications and alarms: a) Differential trip A-phase,
High set Differential (ABC convention),
b) PRV Operated.
c) Buchholz alarm & trip appeared.
d) High-set R ph E/F operated. (RYB convention)
4.1 Figure 3.1 Sweep frequency response curves of Individual HV of each phase-Neutral, keeping all other terminals floating (open Circuited).
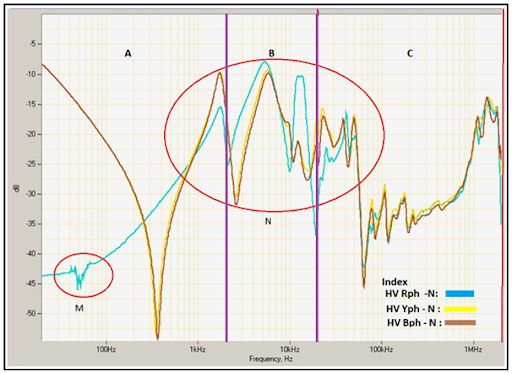
Analysis:
i) The R ph (Blue colored) amplitude rises from -44 dB to -15 dB,
i.e., the frequency response curve is rising in amplitude, contrary to
the characteristic of the response curve drooping from higher
amplitude to lower amplitude.
ii) The irregular distortion in amplitude of R ph in the “A” region
between the 30 Hz to 60Hz frequency range is shown under “M”,
indicating that the core got affected. The core laminations could be
seen in the Photograph in fig. 3.6.
iv) The R ph response curve is irregular and distorted in the
frequency range zone “B” and also extends up to 60 kHz in the zone
“C”, indicating that the winding is badly affected, involving a
*common winding.
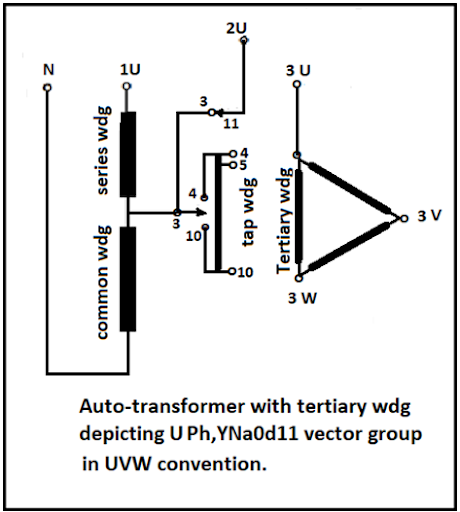
[Note: *Winding configuration in an autotransformer is shown in figure
3.1 B.]
v) The Y-phase & B-phase curves are congruent, showing their status as
healthy.
4.2 Auto-transformer Schematic diagram.
4.3 Figure 3.3 Sweep frequency response curves of Individual IV (Intermediate voltage) of each phase-Neutral, keeping all other terminals floating (open Circuited).
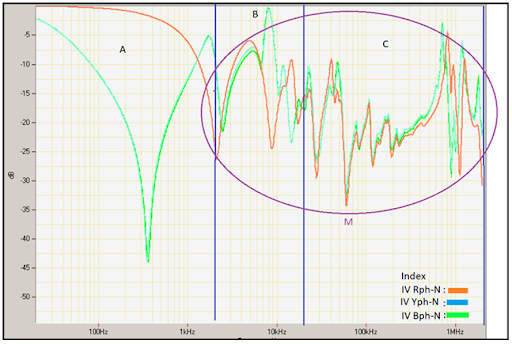
Analysis:
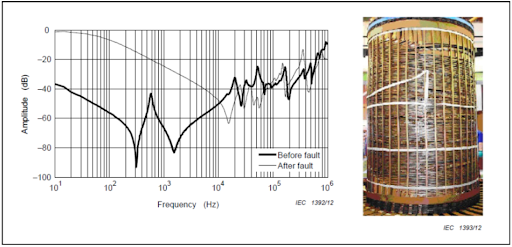
i) The trace of the R ph curve in the zone “A” droops in a parabolic
shape from -1dB to -27dB. Reference may be made to the sample graph.
4. which is from the standard IEC 60076-18-2012, it could be noticed
that the R ph trace in figure 3.3 resembles that in figure 3.4 in the
frequency range of zone “A”. Looking at this resemblance, it could be
opined that a turn-to-turn short in the tap winding must have taken
place in the R phase between the IV terminal and neutral. The heavily
carbonized lead and in the vicinity thereof, with burning of wrapped
paper insulation confirmed as shown in figure 3.5.
ii) The R ph curve in the “B” region is erratically distorted in the
frequency range from 9 kHz to 2 MHz (as shown encircled in M) in Fig.
3.3, indicating that the R Ph common winding is badly affected. The
lead thereof is also affected.
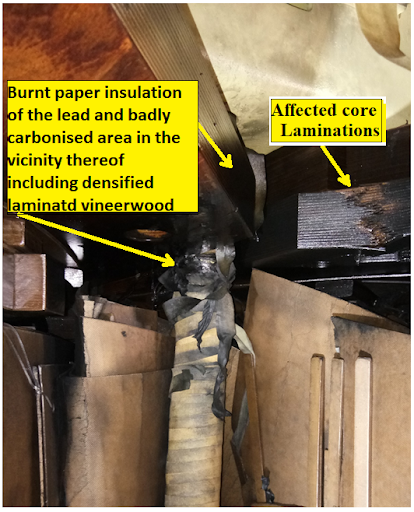
iii) The internal inspection of the transformer was carried out, and
the photographs taken are shown in Fig. 3.5 and Fig. 3.6 and they
confirm that:
a) IV - R ph winding lead and the vicinity thereof were observed to
have been heavily carbonized, and there was also burning of the paper
insulation, affecting the core images. (Refer to fig. 3.5.)
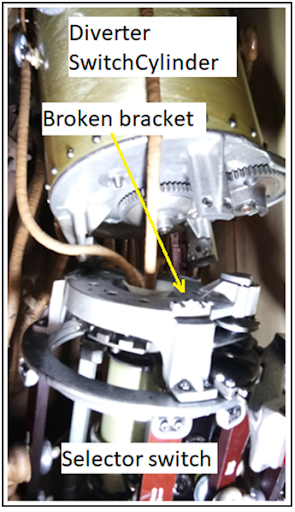
b) The coupling between the selector switch and the diverter switch of
R ph OLTC was found separated due to the breaking of the fastening
brackets on the selector-switch assembly, perhaps on account of axial
force. (Refer to fig. 3.6.)
iv) The Y-phase & B-phase curves are congruent throughout the sweep-frequency range, which confirms that the Y- and B-phase windings are healthy.
5.0 CONCLUSION:
1). The utilities must take utmost care and prepare a small note
describing every operation sequentially before any operations in any
HV /EHV Sub-Stations/Switch-yard.
2). The SFRA is a powerful non-invasive technique for assessing the
health-status of the transformer. It is a single test to evaluate the
mechanical and geometrical integrity of the transformer. This Test is
adopted in a big way all over the world; subsequent to the issuance of
International Standards and CIGRE reports, viz., IEEE C.57 149-2012,
IEC 60076-18-2012 and reports of CIGRE working Group A2 report Nos.
342 -April 2008 and 812 -Sept 2020 have been published.
6.0 REFERENCES:
- CIGRE report by Group A, No. 342-April 2008.
- IEEE Std. C57.149-2012.
- CIGRE report by Group A2, No. 812-Sept, 2020.
- IEC 60076-18-2012.
- Webinars by Megger.
- Alexander Kraetge of Omicron Electronics, Klaus, Austria, and associates: Experience with the practical application of SFRA on Power Transformers.
About the Author
Er. K.K. Murty, FIE (India), CE (India), is a veteran electrical engineer with over 33 years of service in MPSEB & MPPTCL. Former Chief Engineer & HOD (Testing & Communication), he has served as advisor, consultant, and faculty across premier utilities and institutions. An empanelled expert with CPRI, he is also a published author and was honoured by IEI Kolkata for his contributions to the electrical engineering profession. You can reach the author at kkmurty05@yahoo.com.